

Written by James E. Kamis on 15OCT2015
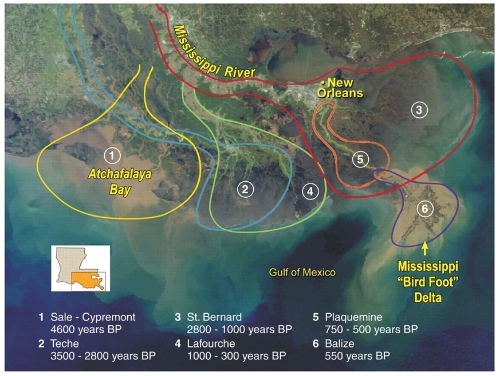
Figure 1 – The Mississippi Delta, Mississippi Flood Plain, and Gulf of Mexico.
7.4 Inches
From 1950 to 2015 the global sea level rose 7.4 inches, a rate of 0.11 inches per year. Yep, that’s it. This is the real story of sea level rise the media refuses to tell you.
Correspondingly, from 1950 to 2015 the global atmospheric temperature increased 0.65 degrees Fahrenheit, a rate of 0.01 degrees Fahrenheit per year. These temperature numbers strengthen the reliability of the sea level rise numbers. Here's why: The 1950 to 2015 nominal atmospheric temperature increase equates to nominal ice-melting power. Nominal ice melting equates to nominal sea level rise from glacial melt water. All these facts tie together and helped confirm their reliability.
During this same 1950 to 2015 time frame, the extent and mass of the polar ice caps diminished very slightly, again correlating well with both the sea level and atmospheric numbers. This small amount of polar ice cap loss is normal in the on-going post-ice era. Interestingly, the Arctic Ice Sheet has gained ice extent and ice mass for three years in a row. Antarctica has progressively gained ice extent and mass for the last 35 years.
In stark contrast to the real story of sea level rise, climate scientists who favor the theory of man-made global warming are saying that global sea levels have been dramatically rising and are now on the verge of flooding the Earth and reeking havoc on coastal cities. They predict, based on the latest climate computer models, that in the not-to-distant future worldwide sea levels will rise catastrophically, thereby flooding many of Earth’s waterfront cities. This man-made global warming-induced sea level rise will reach its full effect in ~100 years.
Really?
Apparently their models have used either “adjusted” data or data from very selective short time periods when sea level rise rates varied relative to the overall, very consistent historical trend. This selective data computer modelling technique was utilized and even remotely plausible until the year 1998. That’s when the current 18.7 year pause in atmospheric temperatures began. Utilizing selective climate computer modelling techniques in the post-temperature “pause” era is risky at best, and some would say highly misleading.
As further evidence that Earth’s littoral cities are in grave danger of flooding, global warming climate scientists cite examples of significant sea level rise and disastrous flooding at select coastal cities. These intentionally selected locations may appear to be strong evidence that sea level rise is indeed a huge problem. However, there is much more to the story concerning what is really causing these localized sea-level rises.
Localized sea level rise at any particular coastal city is controlled by the complex interaction between geological processes, major hurricanes / typhoons, man-made engineering changes, and to a far lesser degree, by the natural worldwide sea level rise associated with on-going post-ice age melting. All of these factors play a role in determining the amount of what is termed “relative” sea level rise at a specific coastal city location.
This article will very briefly describe the impact that geological forces and man-made engineering projects have had on local changes in sea level, leaving discussions of the erosive and land-building power of hurricanes and typhoons to others.
Let’s review the impact geological forces and human engineering projects have had on the sea level of one prominent US coastal city: New Orleans. New Orleans is built on an ever-changing river delta system that is naturally sinking at significant rates as the mushy and water-filled soil beneath the city compacts. These rates are substantial. New Orleans is currently sinking at one inch per year, 8.3 feet in 100 years, purely due to normal geological processes.
The Mississippi Delta, the New Orleans substrate, is constantly changing in ways most folks don’t appreciate. Take a moment to review the geological image of the Mississippi Delta atop this article (Figure 1). The map illustrates major historical shifts in delta water flow and resulting mushy soil layer deposition. Keep in mind these are just the major changes. The mighty Mississippi Delta literally changes every year during the spring flood. This annual flood activity tangibly alters relative sea levels in many portions of the delta. It does this by either eroding certain areas that the ocean back fills, or by depositing new soil and pushing out the ocean. These types of sea level changes are called “relative” sea level changes.
Again from Figure 1., note the location of the Atchafalaya Bay. This Bay is one of the most infamous stories in Mississippi River history. Located at the north end of the Atchafalaya Bay is the Atchafalaya “cutoff”. The Army Corps of Engineers realized in the late 1950’s that the Mississippi River was about to change flow direction into the Atchafalaya Bay and thereby abandon its flow south into the City of New Orleans. This would dramatically affect the city by silting up the port and polluting the cities fresh water supply as salty seawater flowed north and up the abandoned old river channel.
To remedy this eminent disaster, in 1963 the Army Corps completed construction of dikes to prevent the river from diverting into the Atchafalaya bay. The dikes have held, although nearly breaking during the 1973 spring flood. If the dikes had failed the “relative” sea level of both the Atchafalaya Bay and city of New Orleans would have dramatically changed in a few years.
Clearly the historical and future relative sea level changes of New Orleans are dominated by natural geological forces and human engineering projects, and NOT by the ongoing minor changes in worldwide sea level. Worldwide sea level changes of 0.11 inches have not, and will not, dramatically affect the health of coastal cities in the foreseeable future. A hundred years from now, the best estimate is that sea level will rise 11 inches, and not the 40 or 50 feet (see Figure 2.)

Figure 2 – The actual sea level rise over the last eighteen years is 1.85 inches,
which works out to 10.4 inches per century. This is similar to the 20th century’s rise of 8 inches,
but much less than the average rise of 4 feet per century for the last 10,000 years as glaciers left by the last ice age continue to melt.
When reviewing national mainstream media global-warming articles concerning the supposed man-made sea level changes at coastal cities or tiny islands in the ocean, stop for a moment and ask yourself are these “relative” sea level changes? Maybe these reported sea level changes have nothing at all to do with global warming, CO2, and so-called rapidly melting glaciers. Maybe these are local natural sea level changes related to geological forces or man-made engineering projects.
Decorum is the process of practicing good taste and propriety. It is an especially important attribute when reviewing other scientists work, because it allows us to open our minds to other possibilities. However, in the case of recent national mainstream media stories that improperly portray the scientific aspects of sea level change, it’s a struggle to maintain that level of professional civility.
This is especially true when the real story of sea level rise is drowned out by fantastical notions and driven by an overeager complacent media who's primary goal is to separate you from your money. Remember, headlines sell papers, papers sell ads, and worse, you're only a click away from feeding their coffers. Keep that in mind the next time you read some ridiculous story about mankind's eventual demise under an ocean of invisible water.