
Written by James E. Kamis on October 6, 2019

Figure 1: Volcanic and Fault Systems Map of Iceland. Note that the Okjokull "climate change funeral" glacier is located atop the active West Volcanic Zone segment of Mid-Atlantic Ocean Rift.
(map credit see here, a few labels by J. Kamis).
In an astonishing turn of events, NASA (National Aeronautics and Space Administration) just cosponsored a "climate change funeral" for an Icelandic glacier positioned atop a volcano that is part of and fueled by one of the most volcanically active faults on our planet, the Mid-Atlantic Ocean Rift System (Figure 1). Here we show how geologically induced heat from the underlying Okjokull Volcano (Figure 1) acted to melt the overlying Okjokull 'funeral' glacier; it had little to do with climate change.
Evidence supporting this follows.
REGIONAL GEOLOGICAL SETTING AND INFORMATION
Iceland is one of the most geologically active islands on Earth because it lies along, was created by, and is still strongly affected by molten lava expelled from one of the 26 major breaks in Earth's outer crust collectively termed Tectonic Plate Boundaries. The specific plate boundary which formed Iceland and continues to anomalously heat huge portions of this island is the Mid-Atlantic Ocean Rift System. A rift system that cuts through the center of Iceland and is acting to pull this island apart at the unbelievable rate of 1 inch (2.5 centimeters) per year.
This pull-apart/divergent plate boundary process generates deep inner Earth reaching open fractures and faults that are constantly being backfilled with upwelling molten hot lava. This process also acts to fuel and maintain Iceland's massive emissions of heat and chemically charged heated fluids. The specific surface geological features that transmit this heat to island bedrock, adjacent oceans and overlying atmosphere include the Greenland/Iceland Mantle Plume (see here, here, and here), volcanoes, lava emitting faults, hot springs, geysers, ocean floor hydrothermal vents and ocean floor volcanoes.
Heat transfer and emissions of super-heated fluid from the ocean floor extensions of Iceland's segment of the Mid-Atlantic Ocean Rift contributed significantly to the May 2010 so-called "Gulf Stream Shutdown." This event is a powerful, regional example of the massive, geologically generated heat that is constantly pulsing from Iceland and its segment of the Mid-Atlantic Ocean Rift System.
Next is the story of Iceland's non-erupting Katla Volcano (see here). A volcano that was deemed slightly active by virtue of recent movement of its deep magma sourcing chamber (molten lava sourcing pool), and supposedly minor emissions of chemically charged steam. A research study by the University of Leeds involved studying the dynamics and monitoring of Katla's emissions. These researchers were shocked to discover that Katla was emitting massive amounts of CO2 into earth's atmosphere as per the following quote: "…Katla is emitting enormous quantities of CO2. The volcano releases at least 20 kilotons of C02 every day. Only two volcanoes worldwide are known to emit more CO2…"
This discover has major implications and draws attention to how volcanologists currently calculate the amount and percentage of CO2 volcanic features emit into earth's atmosphere.
Katla's is a Non-Erupting Volcano. Most volcanologists had considered emissions from non-erupting volcanoes of only minor consequences relative the total amount and percentage of CO2 in our atmosphere. This notion must now be reevaluated to include the likely significant amounts of CO2 being emitted from earth's non-erupting volcanoes.
Very few if any non-erupting volcanoes are emission monitored. So, the above quote by the University of Leeds that only two volcanoes emit Katla like amounts of CO2 is not backed by enough data to be considered correct.
Defining the isotopic fingerprint of volcanic CO2 or fossil fuel CO2 is a difficult task (see here and here). As a result, there is no 100% reliable way to distinguish between these two sources of atmospheric CO2. This is extremely important point relative to the contention, as per the Climate Change Theory, that human CO2 generation is 100% proven to dominate recent increases in total percent of atmospheric CO2 concentration. It is here contended as per evidence from several sources that the isotopic fingerprint of volcanic CO2 and CO2 from the burning of fossil fuels are identical (see here and the following quote from this reference). "Both tectonic and volcanic CO2 are magmatic and depleted in both 13C & 14C. In the absence of statistically significant isotope determinations for each volcanic province contributing to the atmosphere, this makes CO2 contributions of volcanic origin isotopically indistinguishable from those of fossil fuel consumption. It is therefore unsurprising to find that Segalstad (1998) points out that 96% of atmospheric CO2 is isotopically indistinguishable from volcanic degassing."
The current loosely estimated rate of worldwide volcanic CO2 emissions comes from a 1991 USGS study by Geologist Terrance Gerlach (see here and the appendix). His study examined the CO2 emission rate of just seven of the earth's 1500 terrestrial volcanoes and three of the estimated 1,000,000 ocean floor hydrothermal vents. Emissions from these few geological features were monitored for a very short time period which is insufficient when knowing volcanic emissions vary greatly through time. Choosing are arbitrary time and short time period is not enough to properly estimate average volcanic emission rates. Gerlach did not examine any of the estimated 500,000 seafloor volcanoes.
The classification of volcanoes as extinct /dormant / active / erupting is not as absolute as you might think. For instance, an “extinct” volcano in Russia’s Kamchatka Peninsula (western border of the Bering Sea) recently erupted catching volcanologists by surprise (see here).
Very few of earth's estimated 1500 land volcanoes or 500,000 ocean floor volcanoes are monitored for changes in earthquake activity which is a direct indicator that the sourcing deep earth magma chamber is moving and becoming more active.
A non-technical characterization of Iceland's regional geological setting and its associated heat flow is that "one-third of all material that comes from volcanic activities on Earth are generated in Icelandic eruptions. Although Iceland is a small country and the volcanic activity zone is even smaller, 33% of all of Earth's lava flows through Icelandic volcanic systems." (see here and here).
LOCAL GEOLOGICAL SETTING AND INFORMATION
Focusing more locally to the island of Iceland geological research studies and large amounts of heat flow data prove that this island is one of the most active "Geothermal Hotspots" on Earth.
It is home to 39 individual currently active geothermal areas (Figure 2) each containing various numbers of hot springs, geysers, or hot water flowing faults. These geothermal areas are all located within the currently active portion of the Mid-Atlantic Ocean Rift System. The Figure 2 map also shows that the Okjokull Volcano and overlying Okjokull "Funeral" Glacier are located immediately adjacent to, or directly above, depending on the latitude/longitude projections employed, a geothermal area.
The Okjokull Volcano is part of Iceland's Western Volcanic Zone or sometimes referred to as the Western Rift Zone. It is one of two large splays of the diverging / pull-a-part Mid-Atlantic Ocean Rift System. This western splay is home to numerous volcanoes, countless secondary faults and very young lava flows all indicative of an active geological setting (Figures 1 & 2)

Figure 2: Map of Iceland active geothermal areas, faults, and lava formations
(map credit geologic time pics, some labeling by J. E. Kamis).
The Okjokull Volcano is located within a high heat geological heat flow area. Figure 3 illustrates this contention because it is a map of high heat surface geothermal areas red dots). Note that the red dots are located on both ends of the Okjokull Volcano, and that high heat flow area matches the area defined as the Western Volcanic Zone / Western Rift.
Researchers who compiled the Figure 3 map described Iceland's heat flow as follows:
"The heat flow map of Iceland generally indicates high values with rather large variations ranging from less than 40 to over 300 mW/m2 (Fig. 3). The highest values generally border or are located inside the volcanic zones. In Borgarfjörður and Breiðafjörður regions in western Iceland is a prominent area with high heat flow that is probably related to the volcanic flank zone of Snæfellsnes. The lowest heat flow is found in the areas farthest away from the volcanic belts. The average heat flow for all of Iceland, according to the map, is approximately 175 mW/m2." (see here).
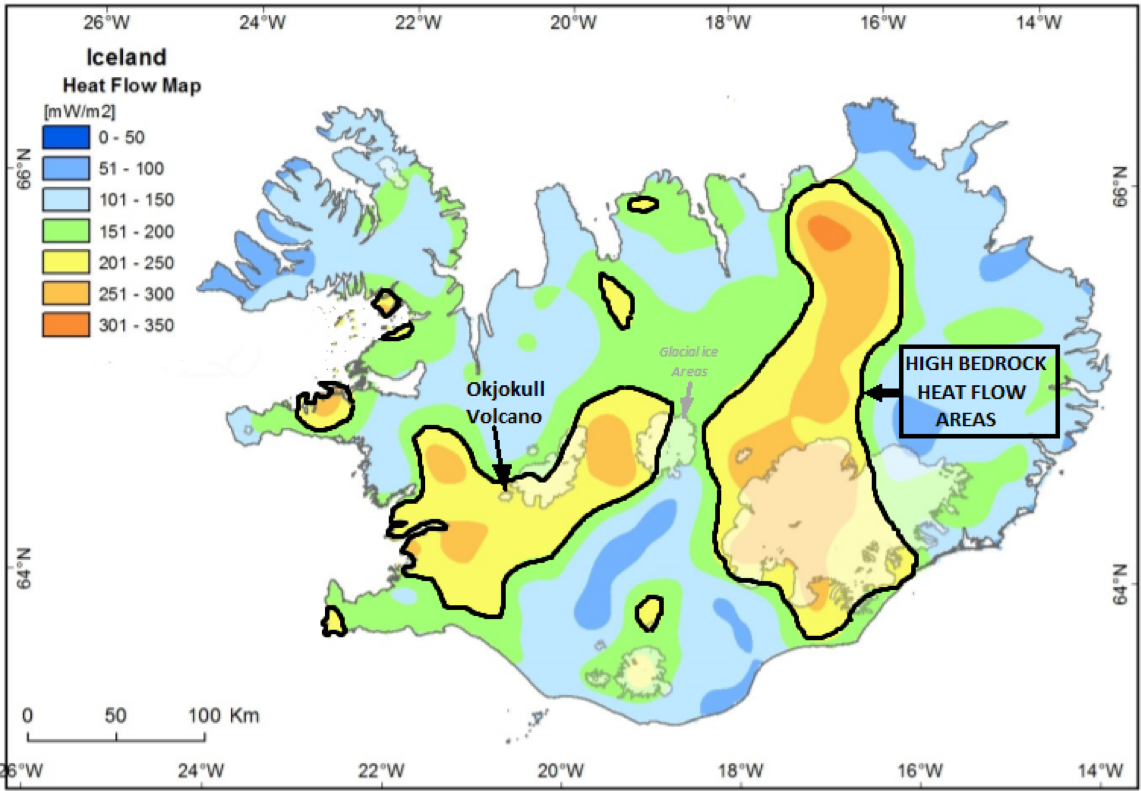
Figure 3: Data driven heat flow map of Iceland. The high heat flow (> 200 mW/m2) reflects roughly the volcanic zones. (map credit see here, some labeling by J. Kamis).
OKJOKULL VOLCANO GEOLOGICAL SETTING AND INFORMATION
Focusing on the geological setting of the Okjokull Volcano and overlying Okjokull Glacier we refer to Figure 4.
This recent satellite image of Okjokull’s funeral glacier absent glacial ice and the adjacent ice-covered Prestahnúkur Volcano (3.7 miles apart) makes a very strong point. Specifically, that it's near impossible that atmospheric global warming would totally melt glacial ice atop one volcano while the glacial ice mass atop an adjacent volcano remains unaffected. Keep in mind the elevations of these two volcanoes’ top glaciers is roughly the same.
A more plausible explanation is that the Okjokull Volcano has recently become much hotter / increased its bedrock geothermal heat flow in recent years. This heat flow increase has acted to rapidly melt the Okjokull Glacier.

Figure 4: The Okjokull funeral glacier absent glacial ice, which is only 3.7 miles (6 kilometers) NW of the ice-covered Prestahnúkur Volcano.
When evaluating whether a specific volcano is actively emitting high heat flow volcanologists utilize all available data and observations including the following:
Active Geothermal hot springs and geysers are present close to the volcano which indicates the local area is volcanically active. The Okjokull Volcano is bounded on the southwest and northwest by active hot geothermal areas (see here and Figure 2). Additionally, summit area of the Prestahnukur Volcano is geothermally active strongly indicating that the summit crater of the Okjokull Volcano is also geothermally. Likely even more geothermally active because they lie along the same heat sourcing Rift Fault Zone as per Figure 2.
Sudden occurrence of earthquake swarms in the local area of the volcano. These swarms often indicate that the sourcing hot molten lava chambers beneath the volcano or local area are moving / becoming more active. This is true of the Okjokull Volcano area (see here and here)
Sudden melting of the glacial ice atop the volcano indicates that the volcano is heating up. Obviously true of the Okjokull Volcano area.
The volcano is located along a known to be very active major break in earths’ crust that has recently experienced very large volcanic eruptions from nearby volcanoes. Obviously true of the Okjokull Volcano area.
Data based heat flow maps show high heat flow. Obviously true of the Okjokull Volcano area.
SUMMARY
Iceland is one of the most volcanically locations on earth. It is positioned above and owes its very existence to emissions of hot molten lava from one of the most active deep earth reaching faults on earth, the Mid-Atlantic Ocean Rift. The Okjokull "Funeral Glacier" sat atop the proven to be high heat flow Okjokull Volcano. This heat flow and not anthropogenic atmospheric warming melted the funeral glacier. Significant amounts of regional, local, and Okjokull Volcano data and research substantiates this contention
NASA's failure to at least mention geologically induced heat flow as a plausible alternative cause of glacial ice melting atop the Okjokull Volcano is extremely difficult to reconcile especially considering the excellence of their reputation, numerous high-quality research studies and staff of dedicated scientists.
Don't get this one.
APPENDIX
Gerlach, T. M., 1991, "Present-Day CO2 Emissions from Volcanoes", EOS, Transactions, American Geophysical Union, Vol. 72, pp. 249, 254-255.